Ionization Energy Trend
Colour the periodic table by first ionization energy (or electronegativity), then trace one period or group to see where the value rises, falls and dips.
Recent
Your last 10 settings, saved only in this browser. Nothing is uploaded.
This ionization energy trend tool shows how first ionization energy changes across the periodic table. It colours every element like a heat map and draws a line chart for one period or one group, so you can see whether the value rises or falls and where the exceptions are. It runs free in your browser, and nothing you type is uploaded.
The tool covers periodic trends in two properties: first ionization energy and electronegativity (Pauling scale). Use it to check a homework answer, compare two elements, or get a quick picture of how the table is organised. Every number comes from one data file, so the chart and the colours always agree.
How to see the ionization energy trend
- Open the Property menu and choose First ionization energy (eV) or Electronegativity (Pauling scale).
- Open the Trace the trend along menu and choose A period (row, left to right) or A group (column, top to bottom).
- Open the Which one menu and pick the number that matches your choice, such as Period 2 or Group 1.
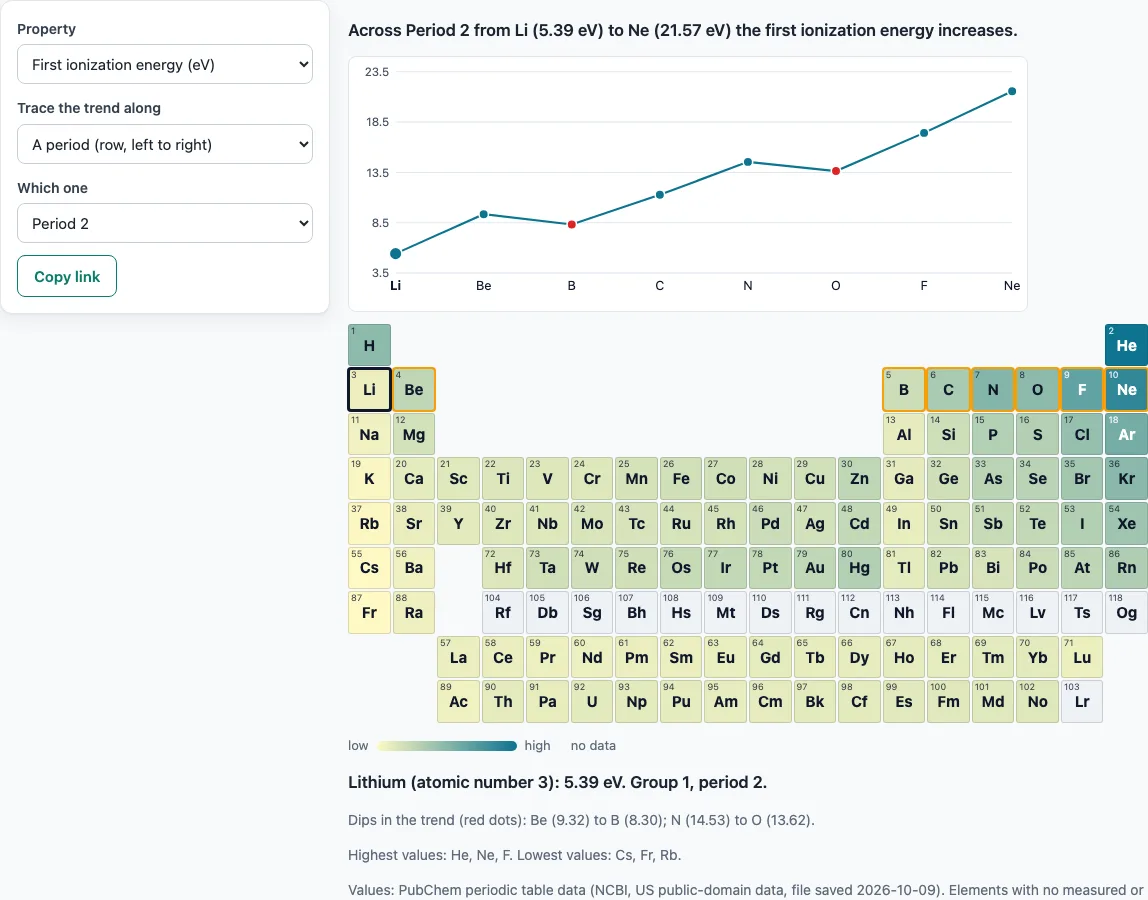
- Read the one-sentence summary. It states whether the value increases or decreases and gives the first and last element’s values.
- Look at the line chart. Element symbols sit on the axis, and for a period, red dots mark each dip where the value falls from one element to the next.
- Find the orange outline on the table, which shows your chosen row or column.
- Click any element in the table. Its value, group and period appear in a line under the table.
- Check the note at the bottom, which names the 3 highest and 3 lowest elements overall for the chosen property.
- Change the property or the period or group and compare how the summary sentence and the chart change.
To keep your settings, press Copy link. The settings are saved inside the link, so anyone who opens it sees the same view. The tool does not print a worksheet.
What is the trend in ionization energy across a period?
Across a period, first ionization energy generally increases from left to right. In Period 2, the tool’s data rises from Li at 5.39 eV to Ne at 21.57 eV. The rise is not perfectly smooth. Choose Period 2 or Period 3 and the tool marks four dips in the first ionization energy data: Be to B (9.32 eV to 8.30 eV) and N to O (14.53 eV to 13.62 eV) in Period 2, and Mg to Al (7.65 eV to 5.99 eV) and P to S (10.49 eV to 10.36 eV) in Period 3.
What is the trend in ionization energy down a group?
Down a group, first ionization energy generally decreases. In Group 1 the tool’s values fall from Li at 5.39 eV through Na 5.14, K 4.34 and Rb 4.18 to Cs at 3.89 eV (hydrogen, at 13.60 eV, sits at the top of the group but behaves differently). In Group 18 they fall from He at 24.59 eV to Ne 21.57, Ar 15.76, Kr 14.00, Xe 12.13 and Rn 10.75 eV. The outer electron sits in a shell farther from the nucleus each time, and inner electrons shield it from the positive charge, so less energy is needed to remove it.
Why does ionization energy increase across a period?
Moving across a period, each element adds one proton to the nucleus and one electron to the same outer shell. The nuclear charge rises, but the new electrons do not shield the outer electrons much, because they are in the same shell. The outer electron is therefore held more tightly, and more energy is needed to remove it. This is why the general pattern rises from left to right.
Why is the ionization energy of oxygen lower than nitrogen?
Oxygen’s value is 13.62 eV and nitrogen’s is 14.53 eV, so oxygen is the easier of the two to ionize. Nitrogen has three electrons in its 2p orbitals, each in a separate orbital, which makes its arrangement stable. Oxygen has four 2p electrons, so one 2p orbital holds a pair. The two electrons in that pair repel each other, which makes one of them slightly easier to remove.
Which element has the highest ionization energy?
Helium has the highest first ionization energy in the tool’s data, at 24.59 eV. Its two electrons sit in the first shell, close to the nucleus, with no inner electrons to shield them. Neon, at 21.57 eV, is high too. For electronegativity, the highest value in the data is fluorine at 3.98, and caesium has the lowest at 0.79. Use the tool’s list of the 3 highest elements to see the top values in your chosen property.
Frequently asked questions
Is the ionization energy trend tool free to use?
Yes. Everything on the page is free to use. Nothing you type is uploaded, and all calculation happens in your browser.
What does first ionization energy measure?
It is the energy needed to remove the outermost electron from a neutral atom in the gas phase. The tool shows it in electronvolts (eV). Second and third ionization energies (“ionization energies” in the plural) are not shown.
Does the tool show second or third ionization energy?
No. It shows only the first ionization energy for neutral gas-phase atoms.
Why are some elements grey on the table?
Grey means the data has no reliable value for that element. Some of the heaviest elements are grey for this reason.
What do the red dots on the line chart mean?
Red dots mark dips, the places where the value falls from one element to the next in a period.
Does the tool show atomic radius or electron affinity trends?
No. It draws only first ionization energy and electronegativity trends.
Can I click an element to see its exact value?
Yes. Click any element in the table and its value, group and period appear in a line under the table. The selected element is also drawn larger on the line chart when it is in the chosen period or group.
Where does the data come from?
The values come from PubChem periodic table data (NCBI), which is in the US public domain. The file was saved on 2026-10-09.
Related tools
- Printable periodic table: use it when you need a paper copy of the table to label or annotate.
- Periodic table with charges: use it when you are working out ion charges alongside trends in the table.
- Periodic table flash cards: use it to practise recognising element symbols and positions before a test.
- Blank periodic table: use it when you want to fill in the trends yourself from memory.
- Chemistry worksheets: use it for practice sheets on atoms, bonding and other chemistry topics.
- Naming compounds practice: use it when you move from element properties to naming the compounds they form.